So you grab your phone and head to the Bureau of Meteorology (BOM) App only to be greeted with their new “simpler” version of measuring the chance of rain. Ah, excuse me, what does this even mean? What follows is my descent into overthinking the information and into slight madness. Please join me as I try to answer the question; Will it rain today?
Is it going to rain today?
Sydney in recent times has been very wet. We seem to be in a very wet season thanks to La Nina (and climate changes). So imagine waking up and seeing some sunlight for the first time in a long time. You look outside, see some clouds and think, is it going to rain?
Chance of Rain
At first glance, two separate pieces of information are displayed. The first statement, “75% (high) chance of no rain,” seems to be the main thing we should observe; it seems to be telling me that there is a 25% chance of rain. So to answer my question, surely I should just look at that. And say, well, there is a 1 in 4 chance it will rain.
But then what’s the other information, what’s that trying to convey? The information seems linked to the first piece of information, but the more I think about it, the more it is not. The next two pieces of information related to the amount of rain that will fall given it is raining.
I now go down a rabbit hole of investigation and analysis that I am not proud of.
For those that need the TLDR - scroll to the bottom for my conclusion.
Let's make this complicated
The first statement has a binary answer, yes or no. Thus we can express the first statement as a Bernoulli Random Variable. (check out the Intuition video on YouTube) These are random variables that only have a Yes or No answer. Let Y be a Bernoulli Random Variable defined as whether it IS raining. Thus we can say that the probability of Y being true is 25%, while the probability of it being false is 75%. Mathematically we can write Y~Bernoulli(0.25).
This is the best way to answer the question, is it going to rain.
But we then need to think about the other information, if there is rain, how much rain.
The other two statements are based on the fact that it is raining. So given that it is raining, the amount of rain that falls is based on the metric they give. We can write these two statements mathematically. Let’s define a continuous variable X that represents the amount of rain that falls in mm. A continuous random variable can take on any value, but there is a limit to the amount of rain that can fall; I'll deal with this later. The wording of the statements needs to be resolved; at least 3mm means 3mm or more, but the following statement is at least 9mm, which means 9mm or more. The question arises is do these statements overlap? So does the at least 3mm include the at least 9mm amount? At this point, I was questioning life and asking whether I was overthinking this; the answer was obvious … yes. I decided to interpret the statements as follows:
Those that know might be keen to draw our Probability Density Function (PDF)! The thing that makes this hard is when does X stop? How much rain can fall, or do we put our pure mathematician hats on and say we let X approach infinity. But that doesn’t make sense, so given their numbers and the amount of rain, the chances of 109mm of rain is almost zero given the forecast (but it could be very likely a few weeks ago when Sydney was underwater). For this exercise, I assumed that the forecast would never have more than 109mm on THIS day (please note I lost sleep over this decision). To get a valid PDF, there are two properties that we need to satisfy:
- That the PDF is always positive;
- The total area under the PDF is 1, which means that it represents all possible outcomes.
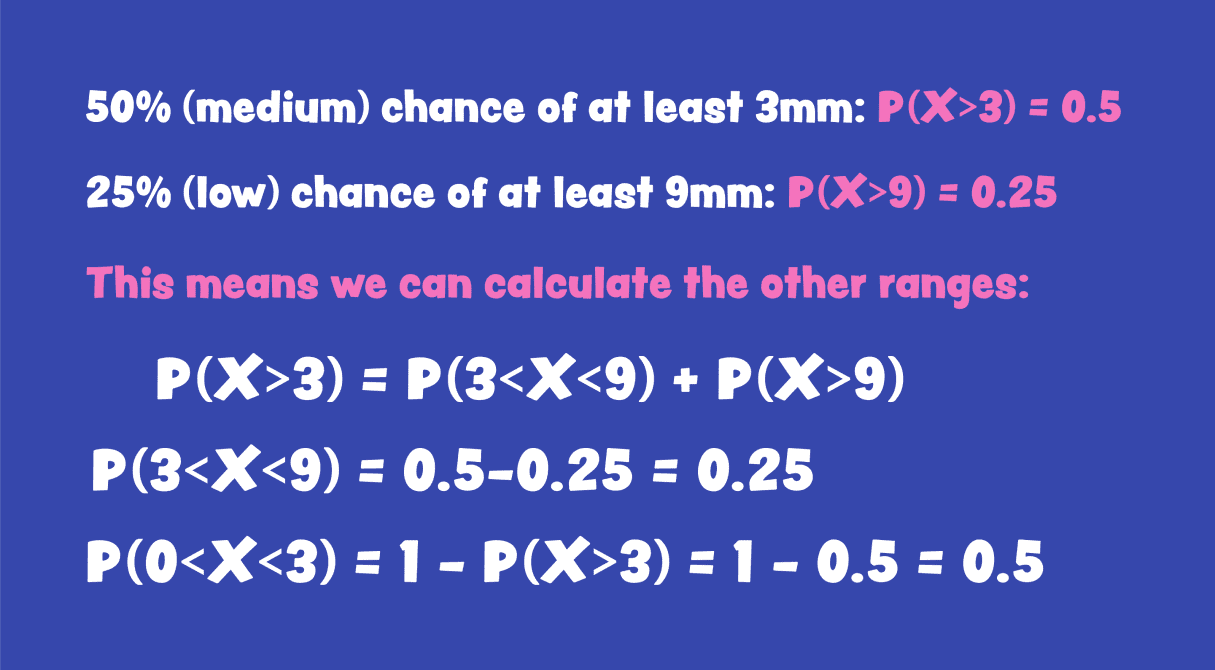
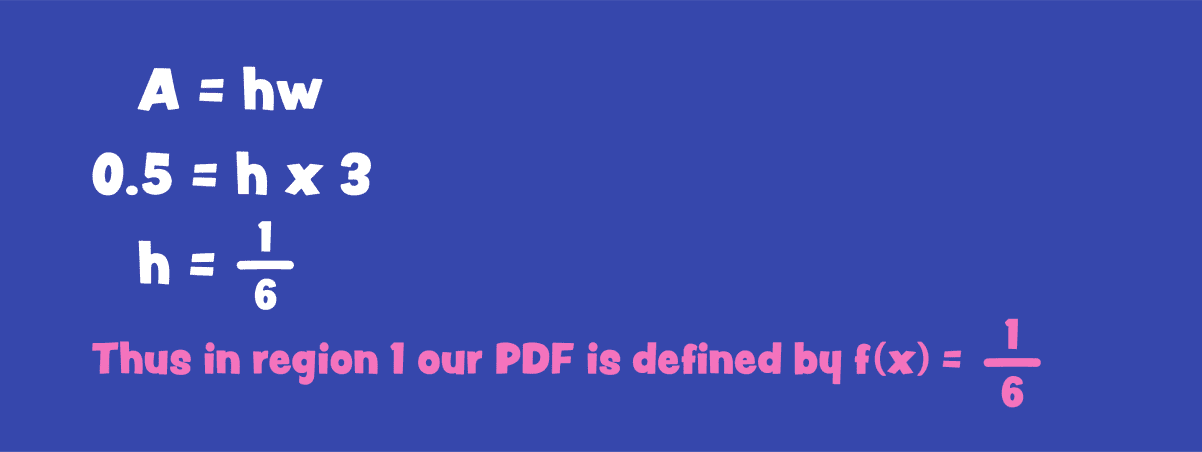
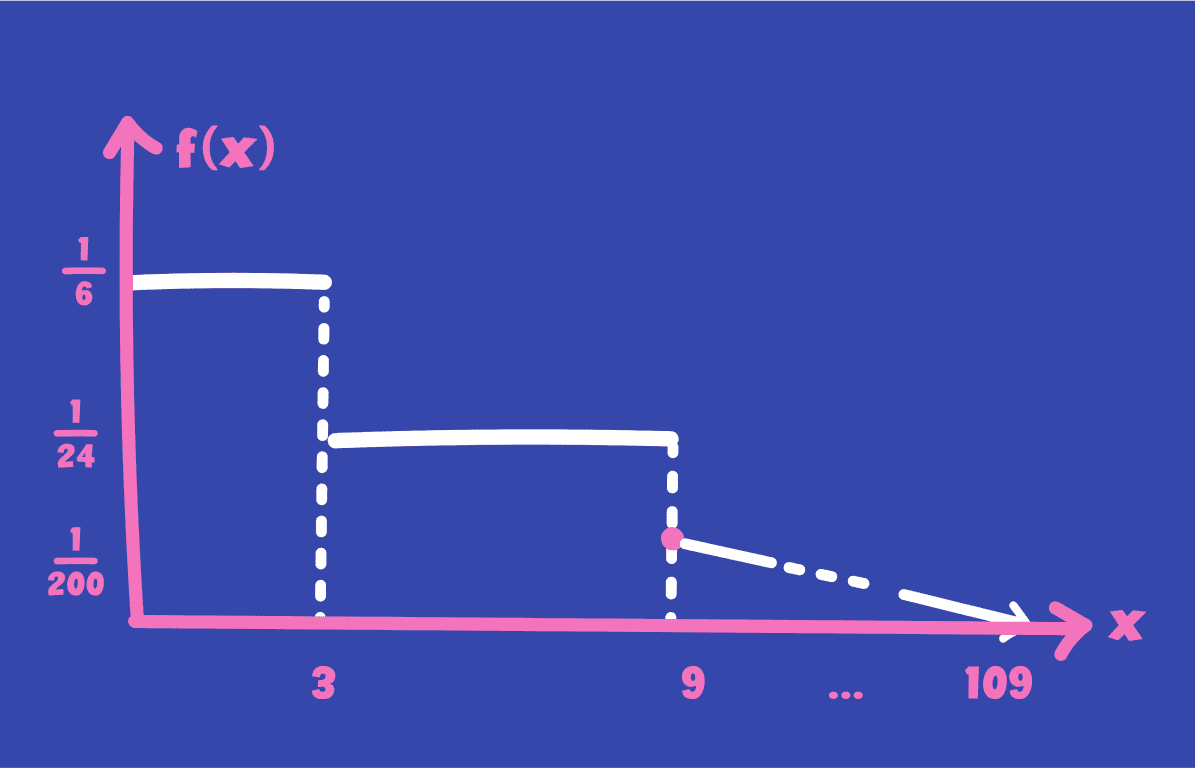
Region 1: 0< x <3 - assume that we have a uniform probability distribution in this region so getting 0.3mm is equally likely as getting 0.245 mm. So in this region, we know that the total area under the PDF should be 0.5 (refer to the work above where we said P(0< X<3) = 0.5). Given our uniform probability, we know the shape of the PDF in this region is a rectangle whose area is 0.5 and width is 3. Thus, we can calculate the height (which is the probability).
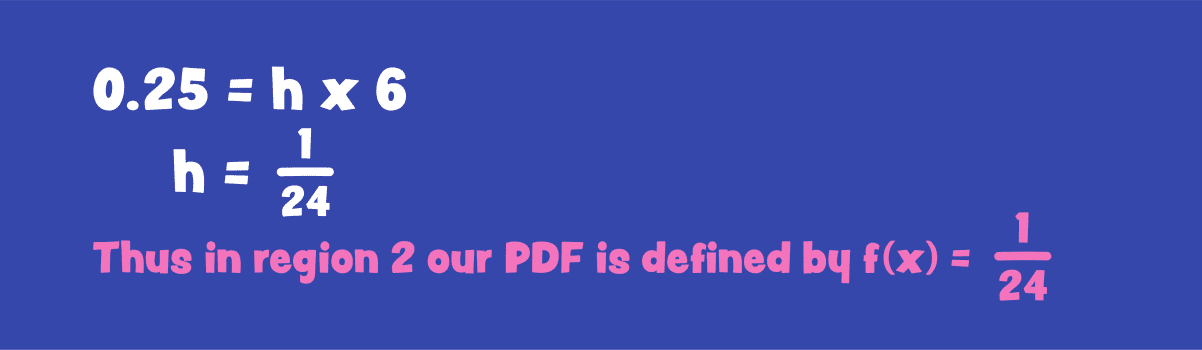
Region 2: 3< x <9 - again, we’ll make the same assumption as region 1 (although the actual probability will be different). We can apply the same argument to find the PDF in this region as we did in region 1.
Region 3: x >9; we’ll change this to 9< x <109 to make things easier. In this region, we’re going to assume that the chance of larger amounts of rain decreases linearly. Why? Because I wanted to keep this easy but somewhat realistic.
Unlike the other regions, we have to consider the probability of large amounts of rain to decrease. The shape of our PDF in this region ends up being a triangle. But we also know the area of the triangle is 0.25. The triangle's width will be 109-9=100 (since we set the maximum amount of rain to 109mm, you can see why I did that). So we need to work out the height, and then we can try to work out the PDF.
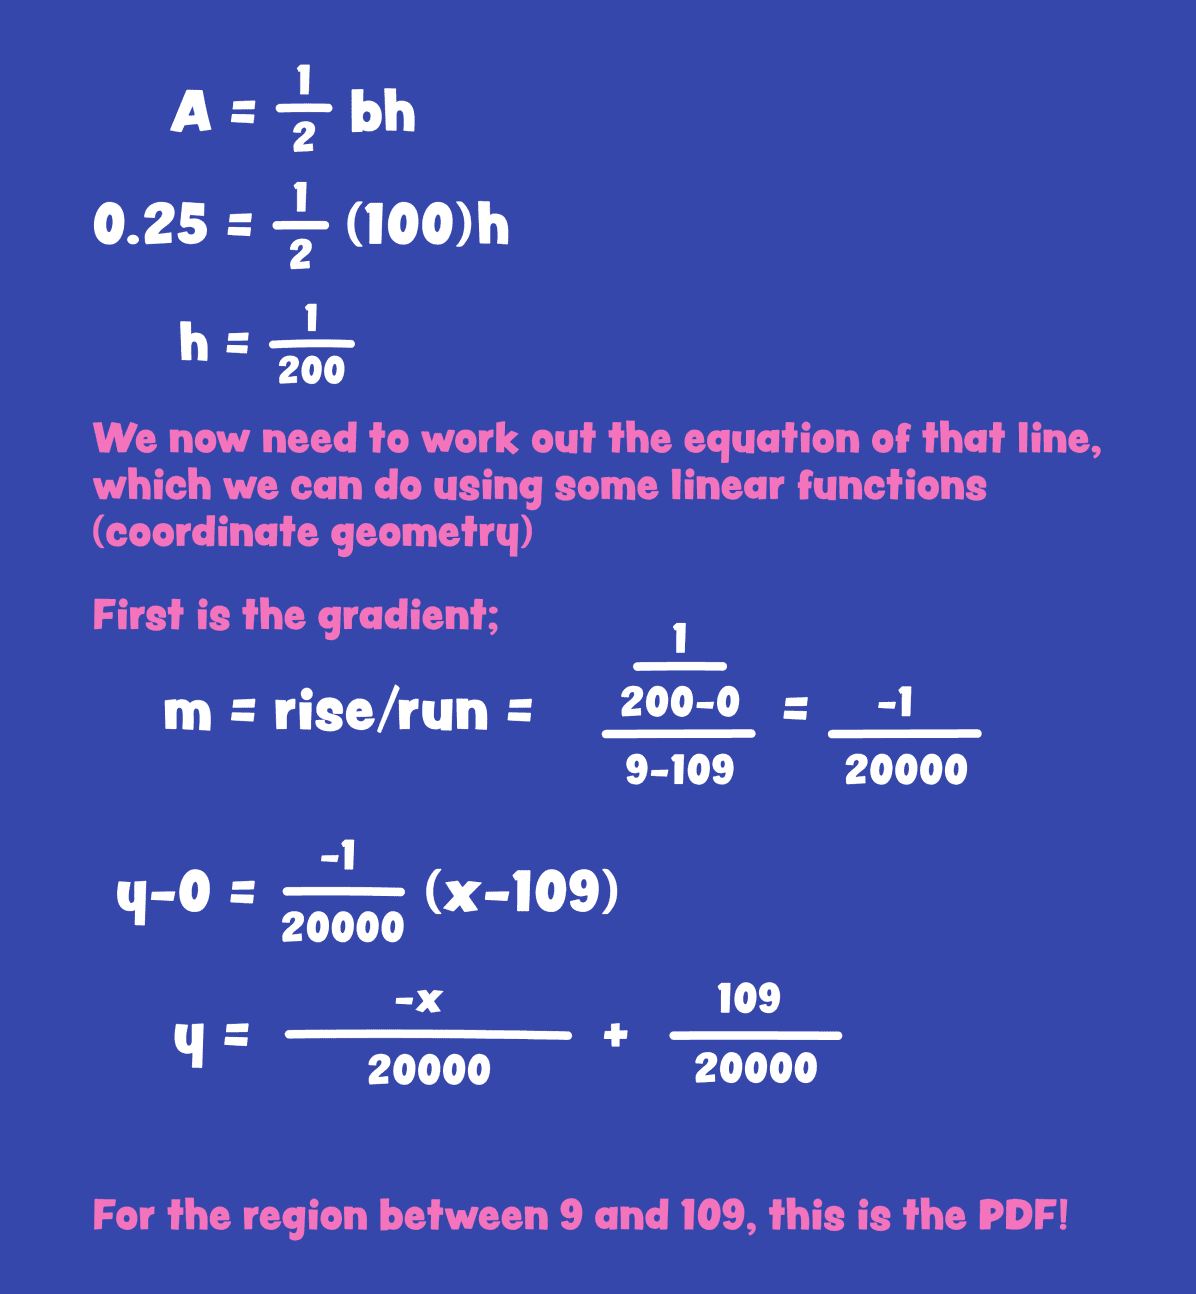
Well, well, well, we now have the PDF, and at this point, you may think that this is a lot of effort to answer is it going to rain. I agree with you, but we’ve come this far. So below is the PDF in all its glory.
The question now arises is what’s the expected value of the rain. The expected value is exactly what it sounds like: how much rain we expect to fall; in a way, it's like the average amount of rain we would expect.
We can calculate this for a continuous random variable using our friend Calculus. We know that
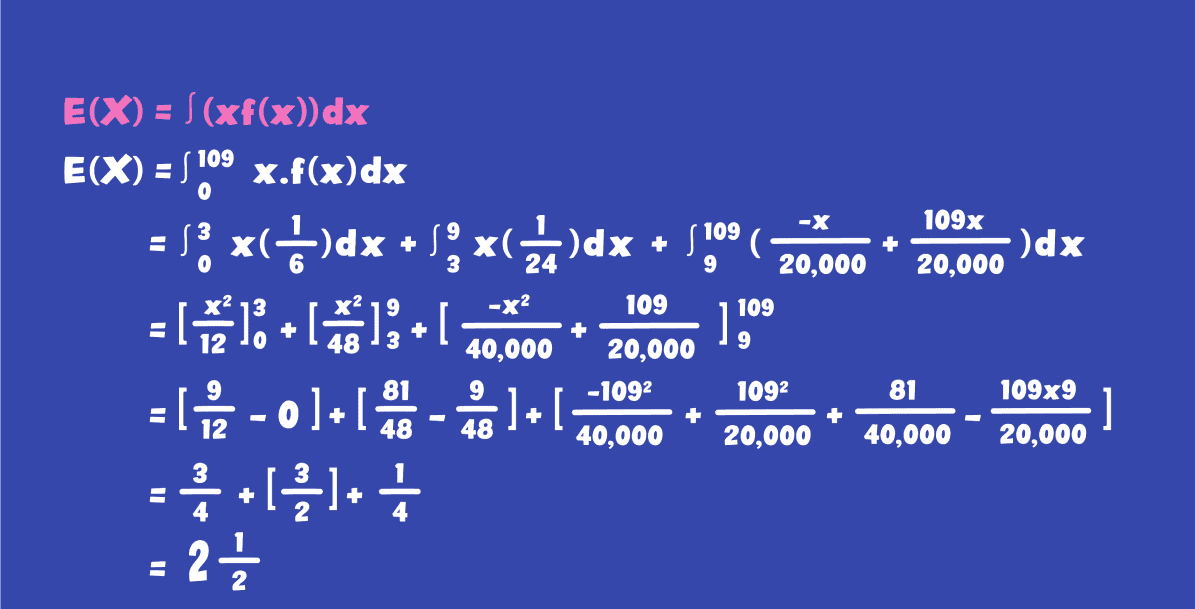
So we see that the expected value for rain (if it does rain) is 2.5 mm. But this is ONLY if it does rain which is only a 25% chance.
Conclusion
So there you have it, the question will is rain … the answer maybe … which i could have told you a while ago.
I’m writing this post several days later and can make and work out the values. It DID rain! So that ¼ in chance proved to be true, now the amount of rain recorded was 3.2mm, which is a bit more than the expected value, which isn’t a surprise (maybe not expected).
After all of this, I’m still in no better position to answer whether or not it will rain. But then I thought, let me check the app … let’s see today’s forecast.
Image Credits: Louise Zhang